Solutions
02 - Monthly and Quarterly Sales Analysis 02 - Monthly and Quarterly Sales Analysis
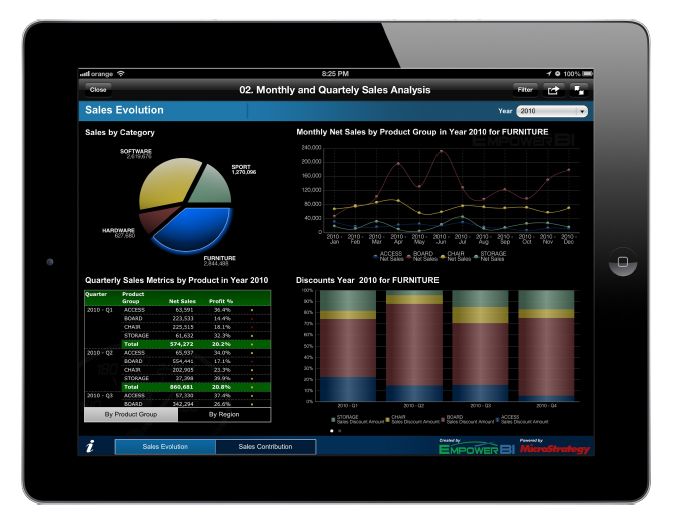
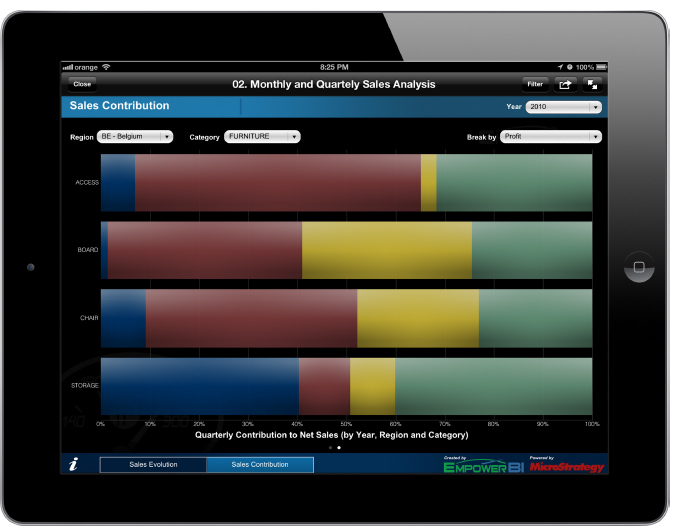
As it names portrays this App offers a comprehensive analysis of their Sales KPIs at monthly and quarterly level.
The dashboard consists of two Dashboards that offer different
perspectives on the Sales Data. Analysis can be undertaken at company level as well as visualise data for a particular Sales Person.
Sales Evolution
The initial Dashboard is highly interactive as you can use the year slicer as well as the different slices of the Categories pie to filter through the data.
You have the ability to compare Product Group Monthly Performance trends for the selected year and category in both a Graphical and Grid manner.
Lastly, they are offer to possibility to analyse quarterly discount spread by Item Group.
Sales Contribution
This second Dashboard provides the facility to analyse the quarterly
Contribution of Sales KPIs for an Item Group level (such as Net Sales, Profit, Invoiced Quantity or Discount Amount).
Aside from the Year selector, you have the ability to slice the data by Region and Category.
CONTACT US