The CFO App goes through the classical GL Reporting analysis. You can commence analysis of the financial KPIs at Company Level, go through the Income Statement, Balance Sheet and are finally presented an insightful breakdown of the company costs.
Company Performance
Company Performance Dashboard provides an overview of the company’s financial state by looking at your GL accounts grouped into revenue, costs and financial items. The dashboard offers comprehensive comparisons of your Net Change vs. Budget amounts as well as monthly trends of your GL amounts.
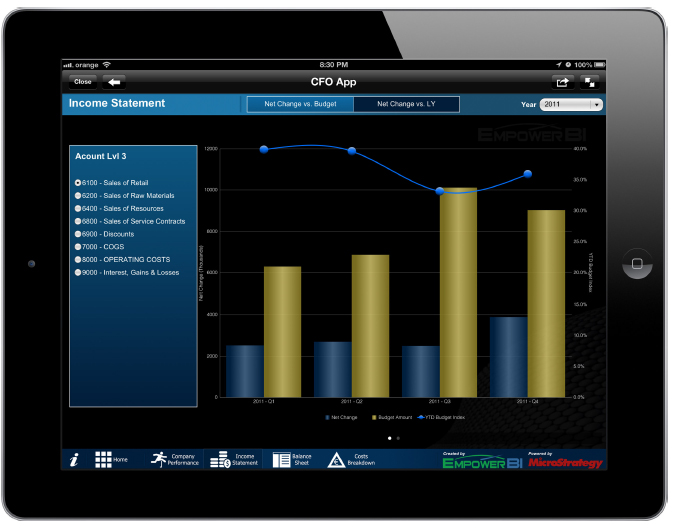
Income Statement
Income Statement Dashboard offers you an insightful comparison between the Net Change Values in your P&L accounts and their respective Budgets as well as their previous year values.
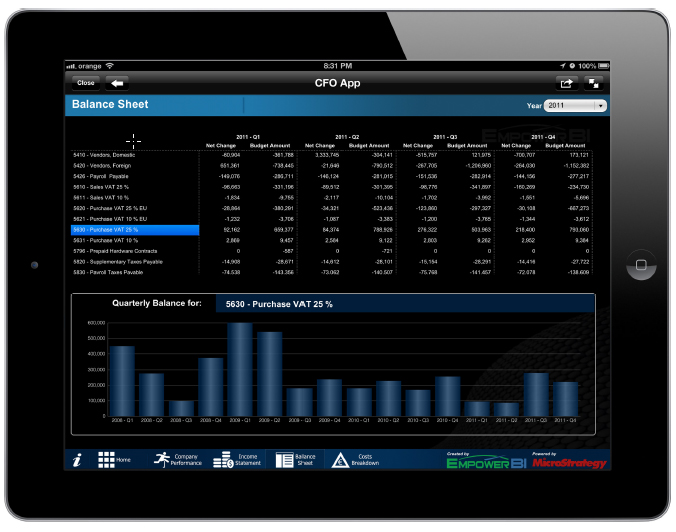
Balance sheet
The Balance Sheet Dashboard offers a quarterly analysis of your Net Change and Budget amounts by Quarter as well as a visual presentation of the evolution of those accounts.
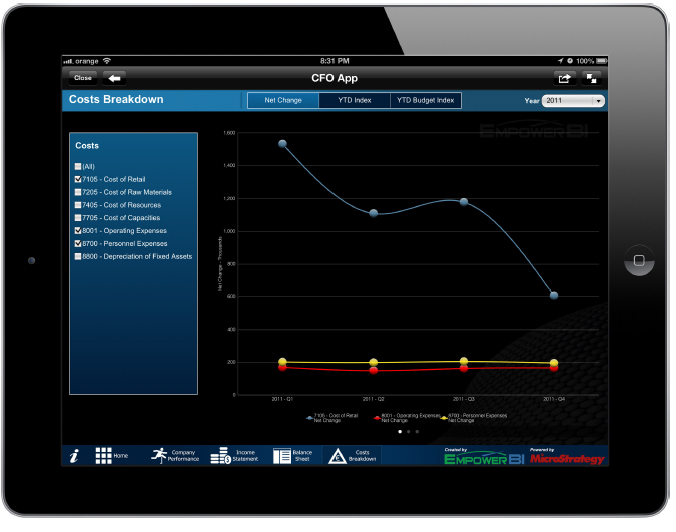
Costs Breakdown
Costs Breakdown Dashboard offers an insight on the quarterly evolution of your various cost accounts such as the operational costs or the personnel expenses and presents a comparison possibility.