This App provides comprehensive analysis on the company’s Payables and an insight into Payables KPIs such as Balance or Average Due Days.
The app consists of 2 Dashboards providing various perspectives on the Payables Data.
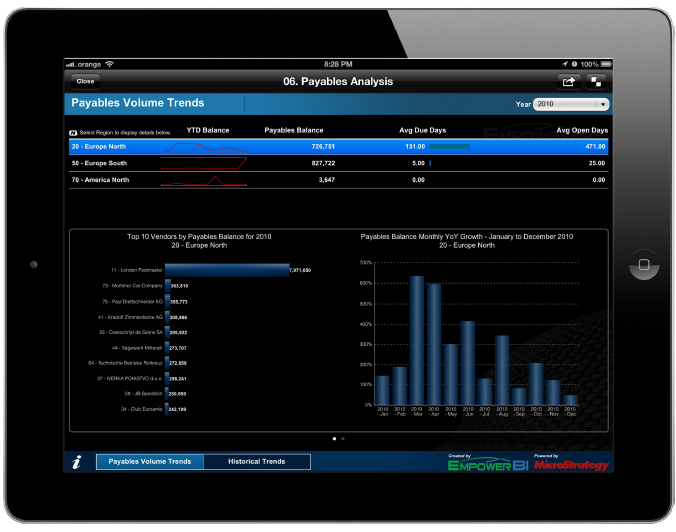
This first Dashboard offers a vast array of information and interactivity.
In the top part you are presented with a series of Payables KPIs such as Payables Balance, Average Open Days and Average Due Days.
The top part of the Dashboard controls the bottom part as the Top 10 Customers by Balance and the Yearly Variance are shown by the selected region.
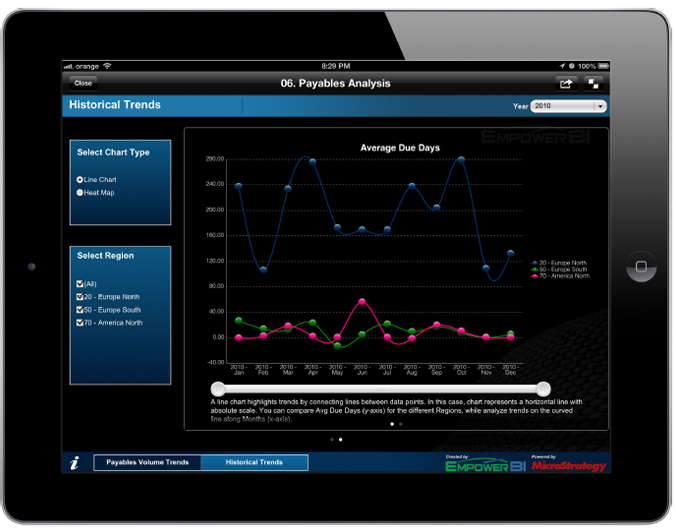
This second Dashboard offers two different visualizations of the monthly receivables performance.
The Line Chart offers the possibility to compare the monthly trends of the Payables Balance by Region as well as restrict the time interval and visually compare evolutions on different periods.
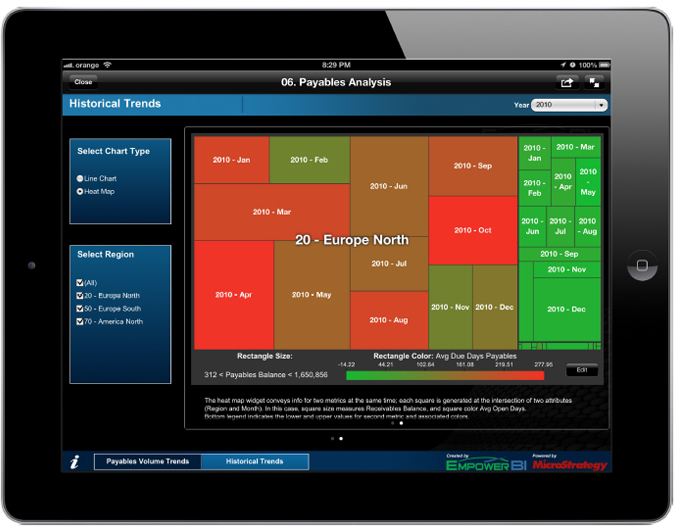
The Heat Map emphasises the correlation of two highly important Payables KPIs: Balance and Avg Due Days.
You are able to identify months that in the first instance seems good (High Payable Balance) but are actually problematic (high level of Average Due Days).