Solutions
07 - Inventory Quarterly Analysis 07 - Inventory Quarterly Analysis
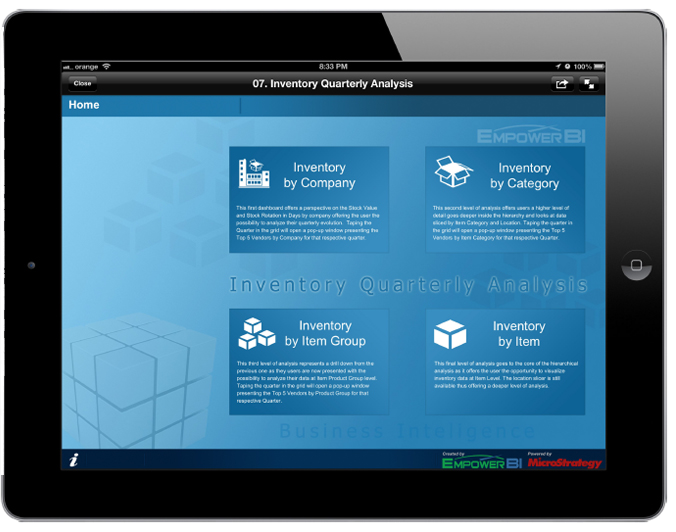
The Inventory Analysis App offers a comprehensive analysis of the stock value variation and inventory turns by quarter.
The app offers a topdown all around analysis giving the possibility to start the analysis at company level and drill down all the way to item and location.
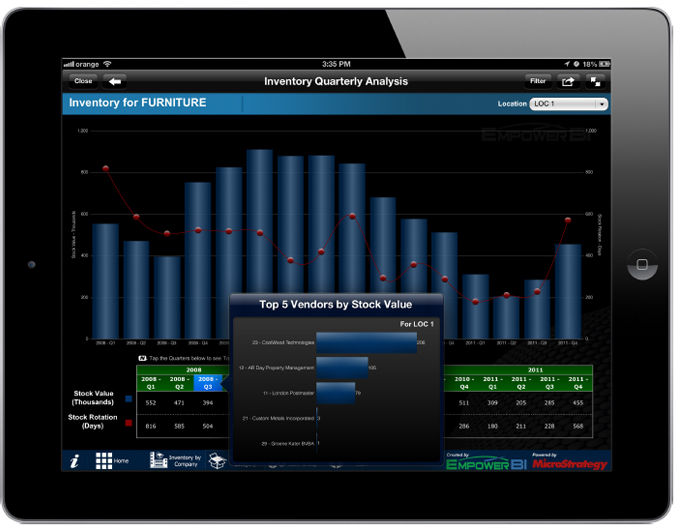
Tapping the Quarter in the grid will open a popup window presenting the Top 5 Vendors by the respective level of analysis.
The application consists of 4 dashboards.
Inventory by Company
This first dashboard offers a perspective on the Stock Value and Stock Rotation in Days by company offering the ability to analyse their quarterly evolution.
Tapping the Quarter in the grid will open a popup window presenting the Top 5 Vendors by Company for that respective quarter.
Inventory by Category
This second level of analysis offers a higher level of detail and goes deeper inside the hierarchy and looks at data sliced by Item Category and Location.
Tapping the quarter in the grid will open a pop-up window presenting the Top 5 Vendors by Item Category for that respective Quarter.
Inventory by Product Group
This third level of analysis represents a drill down from the previous one as they provide the to analyse the data at Item Product Group level.
Tapping the quarter in the grid will open a pop-up window presenting the Top 5 Vendors by Product Group for that respective Quarter.
Inventory by Item
This final level of analysis goes to the core of the hierarchical analysis as it offers the opportunity to visualise inventory data at Item Level.
The location slicer is still available thus offering a deeper level of analysis.
CONTACT US