The Sales Analysis App is the flagship for our sales analysis suite.
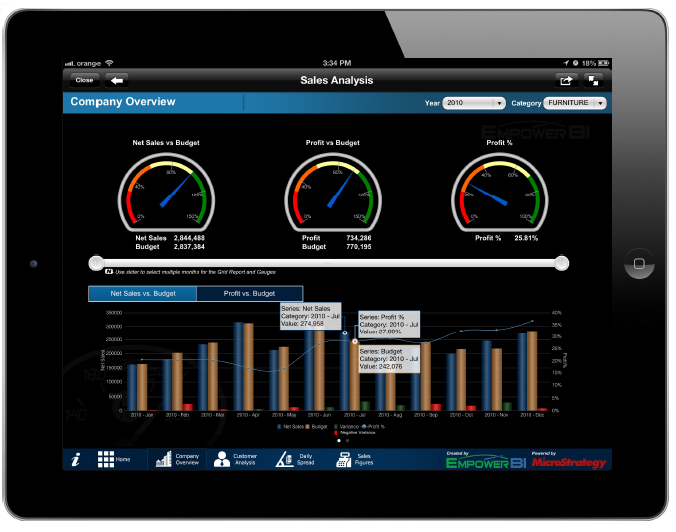
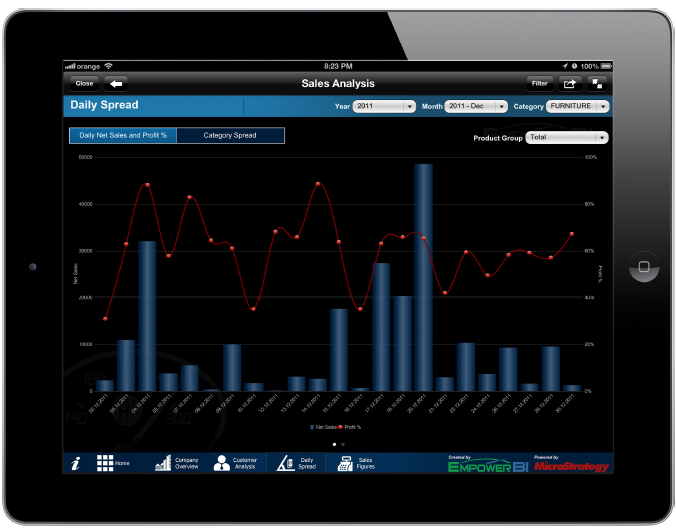
This highly complex app give you a tool to analyse your sales data at different levels by presenting a large variety of KPIssuch as Net Sales, Budget, Profit or Discounts as well as comparisons with Previous Periods Values or Targets.
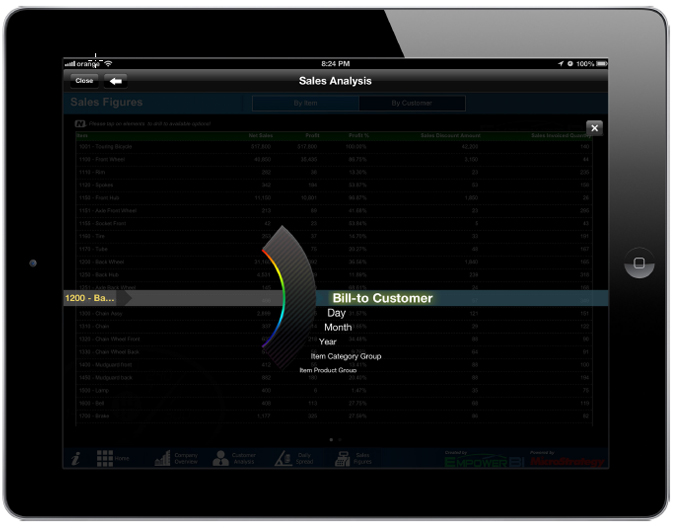
You can browse the Sales Data in an organic and intuitive manner, starting at company level and reaching all the way to Item Daily Sales analysis.
This highly complex app give you a tool to analyse your sales data at different levels by presenting a large variety of KPIssuch as Net Sales, Budget, Profit or Discounts as well as comparisons with Previous Periods Values or Targets.
You can browse the Sales Data in an organic and intuitive manner, starting at company level and reaching all the way to Item Daily Sales analysis.